Last Updated: October 30, 2026
Quick Summary
Integrating wearable data into hockey training plans means using accelerometer, heart-rate and GPS metrics to set one weekly focus, then adjusting load, intensity and recovery based on what the numbers show. Collect a clean baseline week first, find the weakest signal, and change one variable at a time.
- Session load equals minutes of work multiplied by a perceived-exertion rating on a 1-10 scale.
- Separate hard skating from heavy shooting, since quality drops when both land on the same day.
- If load stays flat and top speed does not move for two to three weeks, raise intensity before adding volume.
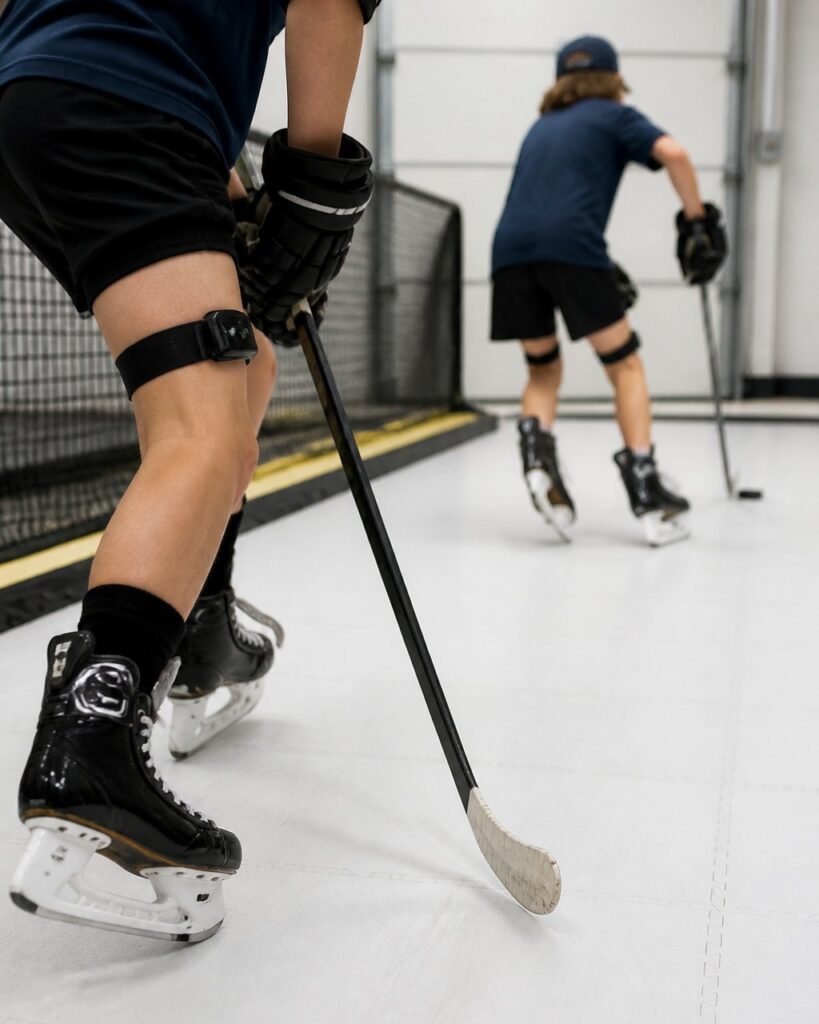
- Keep device placement identical all week, because a moved sensor is a new baseline.
- Get parent consent before tracking younger players and never post a child’s data publicly.
Table of Contents
- Why Wearable Data Belongs in Your Off-Ice Plan
- What Wearable Data Is Most Useful for Hockey
- Hockey Training Load Monitoring: Reading the Week
- Heart-Rate Monitoring for Hockey Players
- GPS Tracking in Hockey: What Skating Metrics Tell You
- Youth Hockey Training Monitoring: Keeping It Age-Appropriate
- Step-by-Step: Turning Data Into a Weekly Training Plan
- Where the Data Stops: Limits, Placement, and Privacy
- Frequently Asked Questions
Why Wearable Data Belongs in Your Off-Ice Plan
Most players train hard and guess. They feel fast some weeks and slow others, and nobody knows why. Wearable data ends the guessing.
Integrating wearable data into hockey training plans turns vague effort into clear direction. A watch or sensor records how fast you skate, how hard you push, and how quickly you recover.
Below, we show you exactly how to turn raw numbers into a weekly plan you can follow.
What Wearable Data Is Most Useful for Hockey
Wearable data is most useful when it answers one question: is this player getting faster, stronger, and harder to knock off the puck? Skip the noise and focus on three signals: movement, skill reps, and effort.
Accelerometer and Movement Data
An accelerometer measures acceleration and deceleration. In hockey, those two actions decide races to loose pucks and quick stops at the boards. Watch the pattern across a session, not a single rep.
- Acceleration bursts: how quickly a player reaches top speed from a standstill
- Deceleration control: how well a player stops and turns without losing balance
- Movement symmetry: whether one side lags behind the other
A common mistake is chasing one big number. In practice, smooth, repeatable movement patterns matter more than a single fast rep.
Stick-Related and Skill Data
Stick and shooting data is harder to capture than skating data, and most wearables ignore it. That gap matters. A player can skate well and still waste scoring chances.
Track skill work the simple way: count quality reps. Log shot attempts and release time by hand. Pair that log with video so you can see the technique behind the number.
Hockey Training Load Monitoring: Reading the Week
Hockey training load monitoring is the practice of tracking how much work a player does over time and adjusting the next session based on that total. Load is not one number. It is the mix of volume, intensity, and recovery across the week, and it only becomes useful when you read those three together.
The Three Load Numbers That Matter for Hockey
Many wearables report a long list of metrics. For off-ice hockey training, three are especially useful:
- Session load (volume × intensity). A simple internal measure: minutes of work multiplied by a perceived-exertion rating on a 1-10 scale. A 45-minute skating-treadmill session rated 7 is a load of 315 by this formula. The absolute number matters less than the week-over-week trend.
- High-intensity skating efforts. Counts of accelerations, hard stride bursts, and near-max speed efforts. These are the reps that build game speed, and the ones that drive fatigue fastest.
- Recovery markers. Resting heart rate, how quickly heart rate drops between intervals, sleep, and the player’s own readiness rating. These tell you whether the load is being absorbed.
Reading a Week: A Worked Example
Here is how a coach might read one week for a 15-year-old forward training off-ice three times plus one team practice:
| Day | Session | Session Load | High-Intensity Efforts | Readiness (1-10) |
|---|---|---|---|---|
| Mon | Skating treadmill, stride technique | 280 | 22 | 8 |
| Tue | Shooting, release and accuracy | 140 | 4 | 7 |
| Wed | Team practice | 320 | 30 | 6 |
| Thu | Rest / mobility | , | , | 6 |
| Fri | Skating treadmill, speed intervals | 360 | 38 | 5 |
| Sat | Shooting, ringette ring control | 150 | 5 | 5 |
| Sun | Rest | , | , | 7 |
Total weekly load sits near 1,250 with 99 high-intensity efforts. Readiness drops from 8 to 5 across the week, a normal pattern when Friday carries the heaviest skating load. The signal to watch is Sunday: if readiness rebounds to 7 or 8, the week was absorbed. If it stays at 5 or 6, next week’s Friday session should drop one interval block.
The Rules of Thumb We Use
- Keep the week-over-week load change modest. Avoid large jumps in weekly load, since sudden spikes can increase soreness and slow progress.
- Separate hard skating from heavy shooting. When both land on the same day, quality drops in both. Put shooting volume on the day after a hard skate, not the same day.
- Treat a flat load with flat speed as a signal, not a success. If load holds steady and top speed does not move for two to three weeks, the plan is too easy, raise intensity before adding volume.
A single wearable number is never a diagnosis. Load, readiness, and coaching observation have to agree before you change a plan. If they disagree, trust the athlete’s feedback and the coach’s eye first.
Load monitoring works when it changes a decision. If the number does not alter next week’s session, it is decoration, not data.
Heart-Rate Monitoring for Hockey Players
Heart-rate monitoring for hockey players shows how hard the body works during shifts and how fast it bounces back between them. Hockey is a stop-start sport, so recovery speed matters as much as peak effort.
Watch two things:
- How fast heart rate drops during rest. Quicker drops suggest better fitness.
- Whether effort matches intent. A player who feels fresh but shows a high heart rate may need more rest.
What most guides miss is that heart rate lags behind effort. A hard shift shows up seconds later. Read the trend across a full session, not one spike.
GPS Tracking in Hockey: What Skating Metrics Tell You
GPS tracking in hockey captures speed, distance covered, and movement patterns in real time. These numbers show whether stride work is actually changing how a player moves on the ice.
Look for:
- Top speed: the ceiling a player can reach
- Distance covered: how much ground a player covers per session
- Acceleration counts: how often a player explodes into open ice
Speed that fades late in a session points to endurance gaps. For players ready to act on stride data, skating treadmill training in Edmonton can help a coach break down technique rep by rep.
Youth Hockey Training Monitoring: Keeping It Age-Appropriate
Youth hockey training monitoring should track growth and consistency, not compare kids to each other. Young athletes change fast, and a number that looks low this month may be normal for their stage of development. Establishing a baseline for these physiological shifts allows coaches to track performance biomarkers that reveal how individual maturation influences long-term athletic capacity.
Keep it simple for younger players:
- Track attendance and effort, not just output
- Watch for fatigue and mood changes, not only speed
- Share progress with the player in plain language
Parents and coaches can review youth hockey team skating sessions for stride work.
Step-by-Step: Turning Data Into a Weekly Training Plan
Turning wearable data into a weekly hockey training plan takes five steps. Do them in order, and repeat each week. Step four covers individualizing by position, age, and return-to-play status.
Step 1: Collect One Full Baseline Week
Record skating, shooting reps, and heart rate without changing anything. The goal is a clean reference point, not a perfect one. Note device placement (wrist, chest strap, skate-mounted sensor) and keep it identical all week, a moved sensor is a new baseline.
Step 2: Find the Weakest Signal
Look for speed that fades late in a session, slow heart-rate recovery between intervals, or low quality-rep counts on shooting. Pick the one signal with the biggest gap between what the player wants and what the data shows.
Step 3: Set One Focus for the Week
Pick a single target, stride length, release speed, ringette ring control under fatigue. One focus per week keeps the feedback loop clean.
Step 4: Individualize the Week by Player Type
This is where a generic plan becomes a hockey plan. The same data reads differently depending on who is wearing the sensor.
| Player Type | What the Data Usually Shows | How to Adjust the Week |
|---|---|---|
| Forwards | High acceleration counts, sharp speed drops late in sessions | Front-load hard skating early in the week; keep shooting volume moderate but frequent |
| Defense | Fewer accelerations, more deceleration and lateral movement | Add deceleration and edge-control drills; watch for asymmetric loading |
| Goalies | Low skating distance, high lateral and reaction load | Track movement quality over volume; cap total session load lower than skaters |
| Youth players (under 12) | High variability week to week | Track attendance, effort, and mood; avoid comparing kids to each other |
| Return-to-play athletes | Readiness lags load by a day or more | Cap weekly load increase tightly; require two consecutive strong readiness days before adding intensity |
Step 5: Split the Week by Intensity and Review
Alternate hard skating days with lighter skill days. Compare the new week to baseline and change one variable at a time.
Change one variable, measure for a week, then move on. Changing three things at once hides what worked.
Worked Adjustments: Three Scenarios
- High-load week with falling readiness. Cut one interval block from the heaviest skating day and move shooting volume to a lighter day. Keep total weekly load flat rather than adding.
- Reduced skating intensity (e.g., a minor niggle). Hold skating volume but drop intensity; shift the week toward shooting technique and ringette ring control, which load the upper body and skill reps without taxing stride.
- Poor recovery indicators (low readiness, slow heart-rate drop). Insert a full rest or mobility day and re-test readiness before the next hard skate. Do not “make up” the lost session by stacking load later in the week.
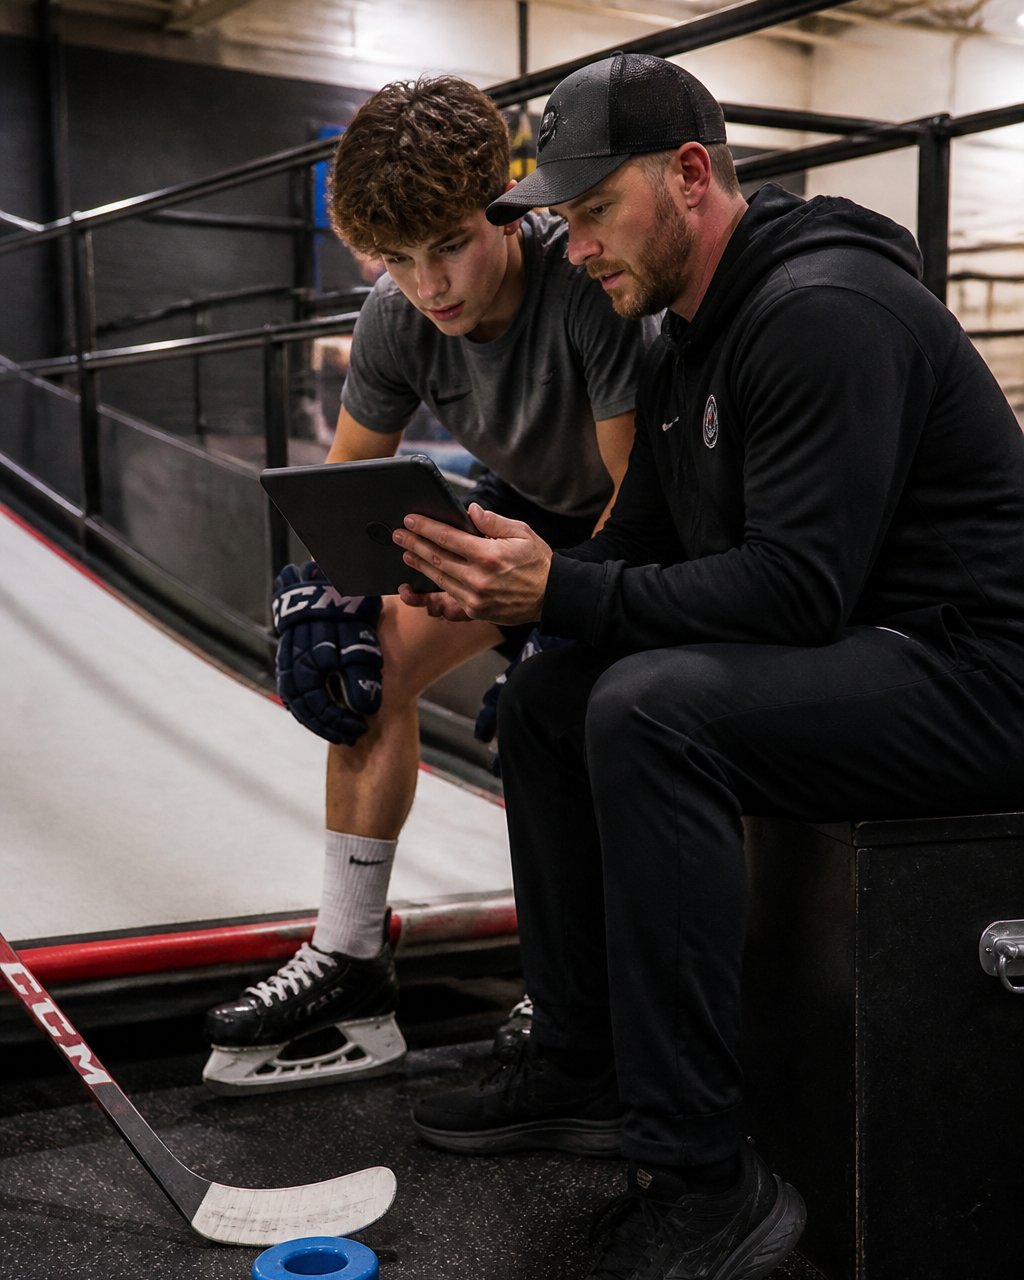
Players who want to pair data with visual feedback can look into hockey video analysis training to see the technique behind each number. When you are ready to put the plan into action, you can view available training sessions.
Where the Data Stops: Limits, Placement, and Privacy
Wearable data has real limits. Sensors drift, placement matters, and no device captures how a player reads the game.
- Placement: a loose strap or wrong position skews movement readings
- Device differences: two brands rarely measure the same way
- Context: a number cannot tell you why a rep looked slow
For younger players, get parent consent before tracking. Keep data private, and share only what helps the player improve.
If you want a deeper look at reading skating metrics over time, this guide on measuring hockey skating speed improvement walks through the full process.
Frequently Asked Questions
What wearable data is most useful for hockey training?
Start with three streams: heart rate, movement data (acceleration, distance covered, speed), and workload totals across the week. Heart rate shows how hard a session actually was, movement data shows skating intensity and stride patterns, and weekly workload shows whether the player is building or overreaching. Skill and stick-related data adds context but is only as good as the device placement. The most useful data is the data you review consistently, not the most advanced sensor on the market.
How do you track training load in hockey?
Hockey training load monitoring combines session duration with intensity, usually through heart rate or a rating of perceived exertion. A simple approach: log every ice session, off-ice workout, and game, then note how hard each felt on a 1-10 scale. Multiply duration by effort for a weekly load number. Compare week to week rather than day to day, and flag jumps that are much higher than the player’s recent average. That pattern, not a single number, is what tells you to adjust.
Can GPS tracking in hockey improve skating performance?
GPS tracking in hockey gives you distance covered, top speed, acceleration counts, and player movement patterns during ice sessions. Used well, it shows whether a player is actually hitting high-speed efforts in games or coasting. Coaches can then target off-ice stride work, such as skating treadmill intervals, at the intensity the data reveals is missing. The data does not skate for the player, but it points to which stride quality and conditioning gaps to work on next.
What are the limitations of wearable tracking in hockey?
Devices can misread effort when placement shifts, and indoor rink environments can affect GPS accuracy, so treat absolute numbers with caution and watch trends instead. Wearables also miss the skill side entirely: they cannot tell you whether a shot release was clean or a stride was efficient. That is why data works best combined with video analysis and coach observation. For youth players, keep collection minimal, explain what is tracked, and get parent consent before logging anything.
Your data only pays off when someone acts on it. At Pro Stride Hockey, we turn those numbers into faster strides and harder shots with a 2:1 player-to-coach ratio, a maximum of four players per session, and video analysis that shows exactly what to fix. Our skating treadmill work and shooting lane facility give every rep a clear purpose. Get started with Pro Stride Hockey and turn your training data into real speed on the ice.
